|
<< Click to Display Table of Contents >> Checklist Summary |
  
|
|
<< Click to Display Table of Contents >> Checklist Summary |
|
The Checklist Summary summarizes the Behavior and Category information for a Checklist.
Checklist Summary Table
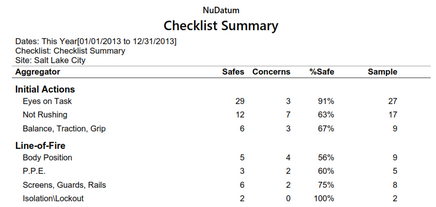
The Checklist Summary Table displays the number of Safes, Concerns, Percent Safe, and Sample Size for each Behavior in the selected Checklist.
| • | The number of Safes and Concerns is calculated by adding the numbers from all observation records that match the filter criteria. |
| • | The Percent Safe is calculated by dividing the number of Safes by the sum of the Safes and Concerns. |
| • | The Sample Size reflects the number of times data was collected for a particular behavior compared to the number of Observations entered containing the Behavior. For example, a sample size of 15 would mean that data was collected for this behavior in 15 of the Observations (had at least one Safe or Concern marked). |
Checklist Summary Chart
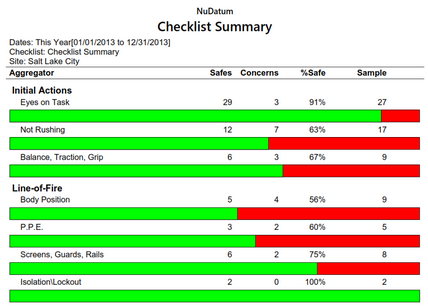
The Checklist Summary Chart displays the same data as the table format but includes a bar representing the Percent Safe.
Checklist Summary Excel Export
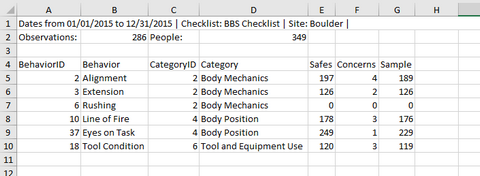
An example of an Excel Checklist Summary Report. Users can easily generate other types of charts or integrate the data into other systems with this format.