|
<< Click to Display Table of Contents >> Grid Reports |
  
|
|
<< Click to Display Table of Contents >> Grid Reports |
|
Grid Reports display the interaction between a variable and the checklist behaviors. Grid Reports are useful for quickly identifying problem areas within complex interactions.
There are dedicated grid reports for Sites, Checklists, Time of Day, Day of Week and all other User-Defined Variables.
Grid Reports display only the Percent Safe measurement.
Grid Table
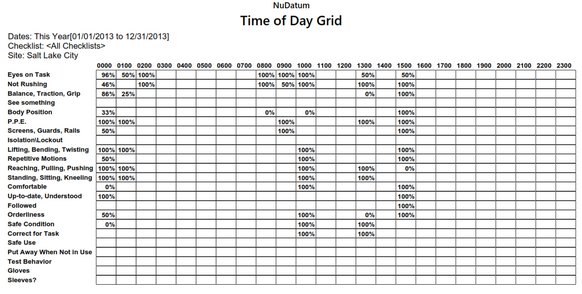
The example above is a Grid Table report for the built-in variable "Time of Day".
Grid Chart
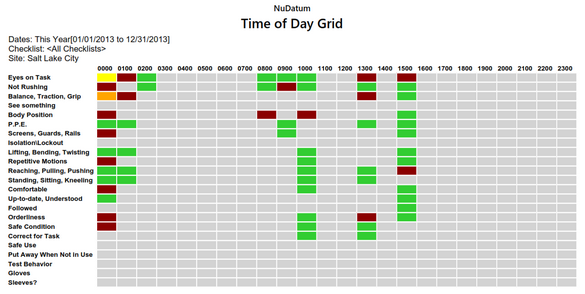
The example above is a Grid Chart for the built-in variable "Time of Day". The color-coding allows users to quickly identify problem areas.
The color thresholds are customizable in the Application Settings screen.
Grid Report Excel Export
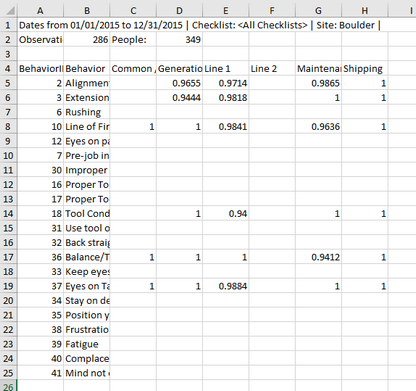
An example of an Excel Grid Report. Users can easily generate other types of charts or integrate the data into other systems with this format.